The scale of COVID-19’s effects means that funders everywhere need better tools for understanding where their funds can do the most good. This dashboard is one of the first efforts we are aware of to collect grant award data across multiple funders and visualize them against indicators of community need. It reflects $40,133,289 of grant awards from 13 COVID-19 response funds in Southeastern Pennsylvania and Southern New Jersey made during the early response phase from March 18 to June 29, 2020. By visualizing funding to date and where need remains high, this dashboard serves as a community asset to help all funders — including many of the participating funds that continue to make grants — plan beyond the initial relief efforts.


The Need: A Snapshot
Pennsylvania and New Jersey Are Among States Hit Early by the COVID-19 Pandemic
Pennsylvania Department of Health and New Jersey Department of Health,
retrieved August 17, 2020
Nonprofits That Serve Our Communities Need Help
Rapid Response: PHL Nonprofits and COVID-19 Survey, Philadelphia Mayor’s Office; data from nonprofit respondents from 10 counties, May 15, 2020
Economic Livelihoods Have Been Upended
Education Has Been Disrupted
May 2020, Edweek
How much money was awarded by participating funds?
Note: Data includes grants made between March 18 and June 29, 2020.
What community needs are grants meant to address?
We coded grants to the following community needs: Economic Activity, Education, Health, Human Services, Housing, Community and Public Service, Legal / Civil Rights, Reliable Information, and Religion. Because up to four community needs could be assigned to each grant, the total in the visualization exceeds the amount of total dollars awarded. Visit Methodology to read how we identified these needs and corresponding sub-categories.
Note: Data includes grants made between March 18 and June 29, 2020.
Who are grants meant to help?
We asked grantees to provide information about special populations they serve, when applicable. Funds and grants where no special population was given are visualized as “Undesignated population.”
Note: Data includes grants made between March 18 and June 29, 2020.
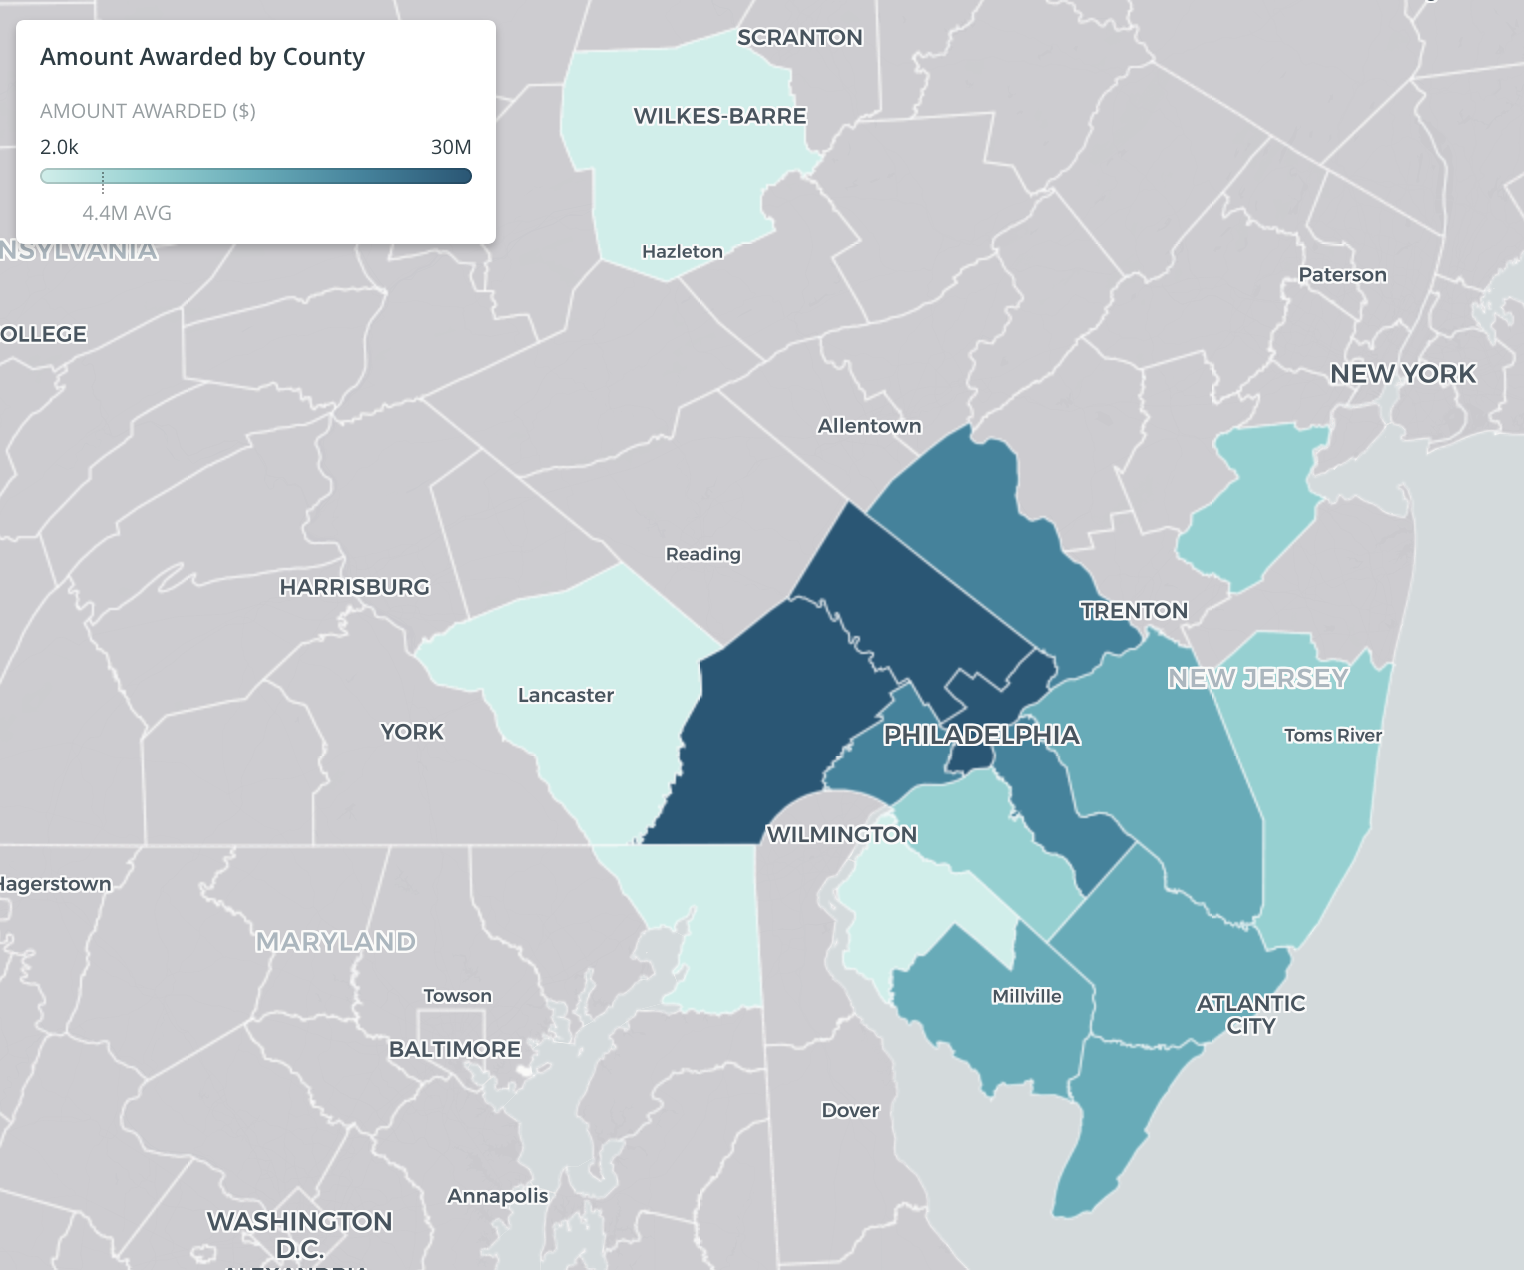
Where did the money go?
We visualized grants awarded at the county-level service level for 13 funds. In addition to the 10-county area that was the focus of this project, the funds awarded grants in Luzerne and Lancaster counties in Pennsylvania, Cecil County in Maryland, and Gloucester, Middlesex, Ocean, and Salem counties in New Jersey.

Note: Data includes grants made between March 18 and June 29, 2020.
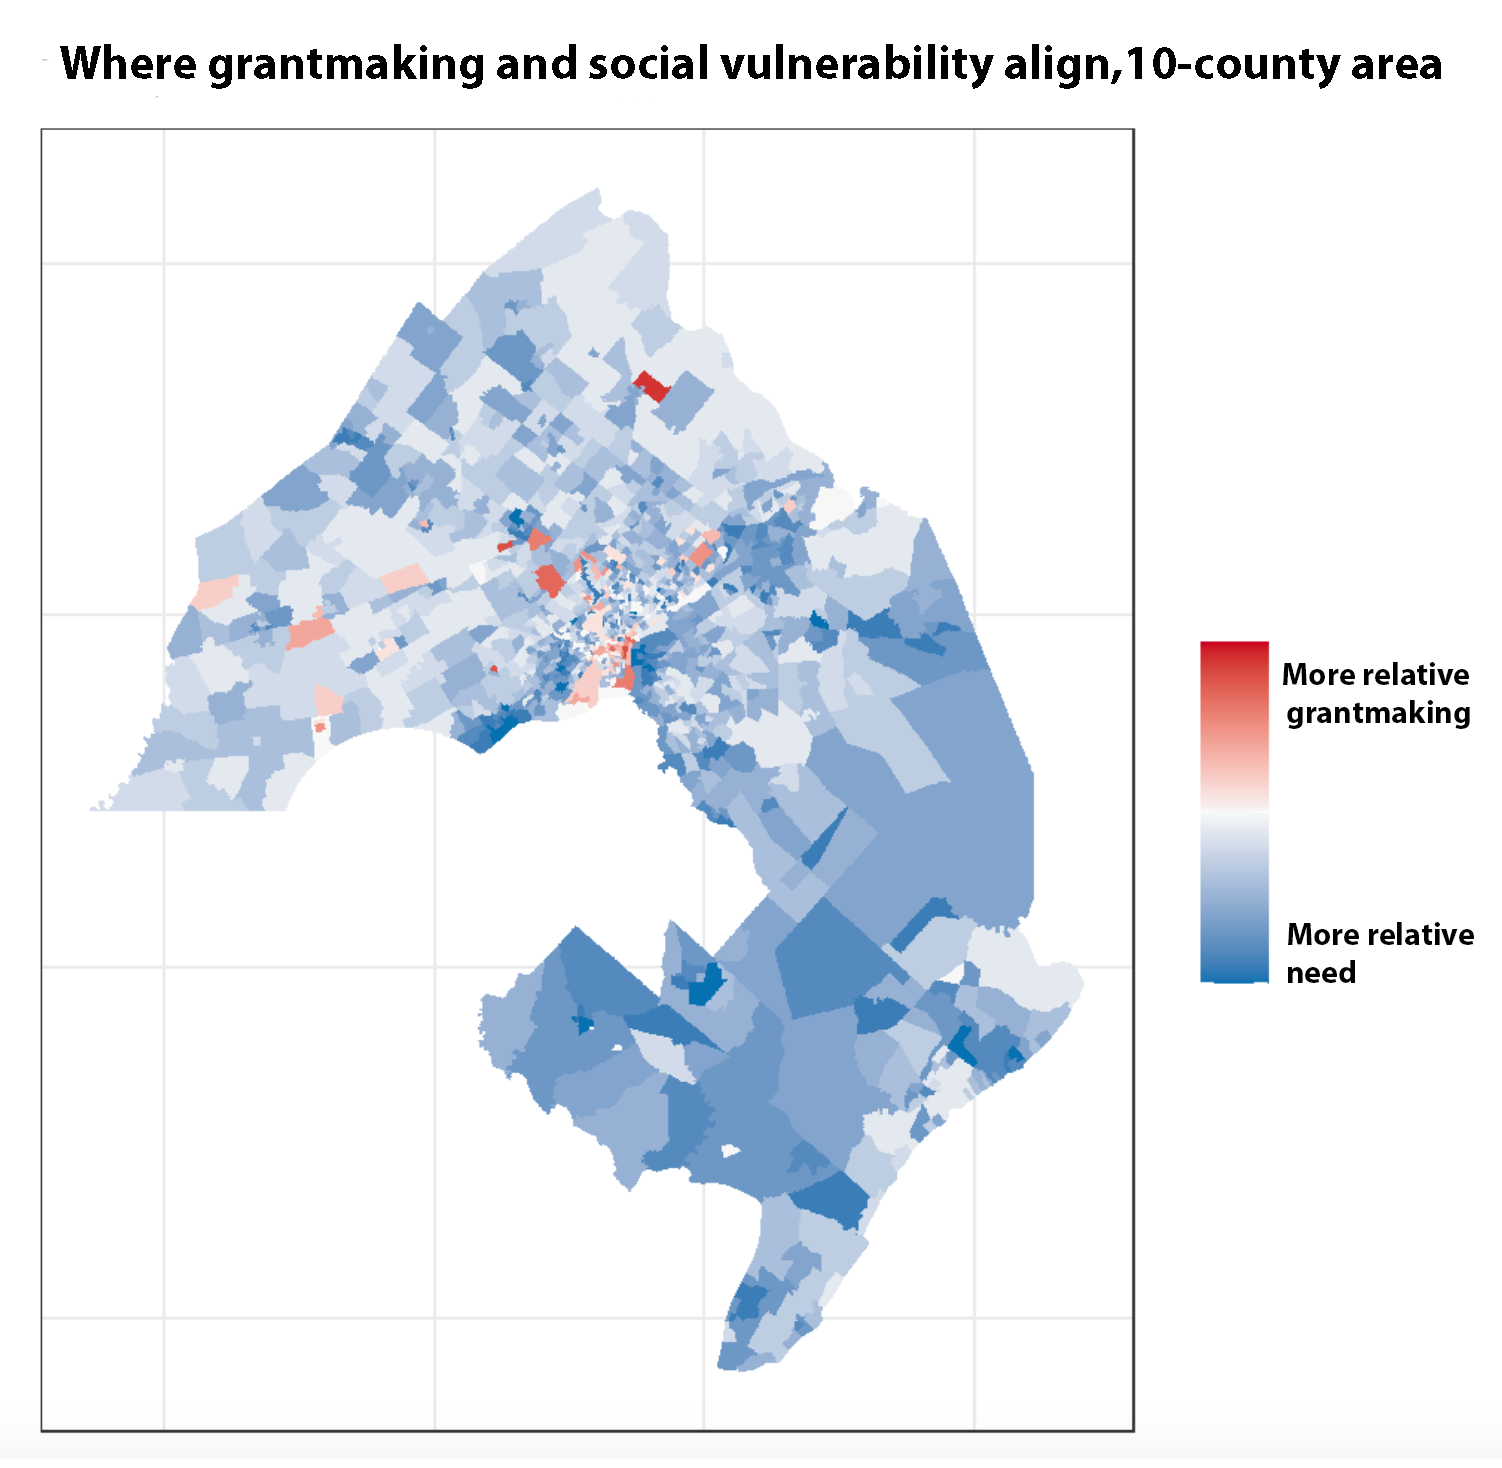
How well were grants aligned with need?
This map shows grant awards by service area — i.e., the geographic area the grantee serves (vs. office address) — overlaid with data from the Social Vulnerability index, a composite of need that includes 15 social factors, including poverty, lack of vehicle access, and crowded housing. Darker shades of blue show Census tracts with more relative need compared to grant awards. They represent areas where future funding may be especially needed.

Note: Data includes grants made between March 18 and June 29, 2020.

