These data visualizations reflect data submitted from 13 COVID-19 response funds that participated in this regional dashboard for grants made from March 18 to June 29, 2020. The funds whose data is visualized here have awarded grants in 10 counties in Southeastern Pennsylvania and Southern New Jersey (Philadelphia, Atlantic, Bucks, Burlington, Camden, Cape May, Chester, Cumberland, Delaware, Montgomery).
More Maps & Analytics
This project includes an interactive tool for place-based needs-assessment, hosted by partner Urban Spatial. Visit the Grantmaking & Need Atlas to see more detail on how grant awards compare to community needs.
How much money was awarded by participating funds?
Note: Data includes grants made between March 18 and June 29, 2020.
Note: Data includes grants made between March 18 and June 29, 2020.
Grants were made several types of organizations and individuals (e.g., sole proprietors of child care centers or visual/performing artists), as visualized below.
Note: Data includes grants made between March 18 and June 29, 2020.
What community needs are grants meant to address?
What community needs were funded by these grant awards? We were able to identify community needs for all but 26 of the grants. Up to four community needs could be assigned to each grant. Visit Methodology to read how we identified these needs and corresponding sub-categories below.
Note: Data includes grants made between March 18 and June 29, 2020.
We visualized the top five community needs supported by the funds. Some funds granted among a wide range of needs, while others, like Arts Aid Philadelphia, Philadelphia Small Business Relief Fund, and Philadelphia Early Education Fund, concentrated on narrower cause areas. Visit Methodology to read how we identified these needs and corresponding sub-categories.
We visualized community needs that received less than $4 million in grants from participating funds.
Note: Data includes grants made between March 18 and June 29, 2020.
Sub-categories for the largest community needs
We visualized the four biggest community needs, Economic Activity, Education, Health, and Human Services, since some grantees indicated they serve a sub-category of need within those causes.
Note: Data includes grants made between March 18 and June 29, 2020.
Who are the grants meant to help?
We asked grantees to provide information about special populations they serve, when applicable. Funds and grants where no special population was given are visualized as “Undesignated population.”
Note: Data includes grants made between March 18 and June 29, 2020.
How diverse is the leadership of the organizations?
To understand how well the leadership of organizations that received grants represented the communities most affected, we asked grantees to indicate whether or not their organization is led by a person who is Black, Indigenous, and/or other Person of Color. This information was provided by Arts Aid Philadelphia; Philadelphia Early Education Fund; Philadelphia Small Business Relief Fund; United Way of Bucks County; United Way of Chester County; and Women’s Way. Funds and grants where no special population was given are visualized as “Not provided.” For more insight into demographics by location, visit the Grantmaking & Need Atlas.
Note: Data includes grants made between March 18 and June 29, 2020.
Where did the money go?
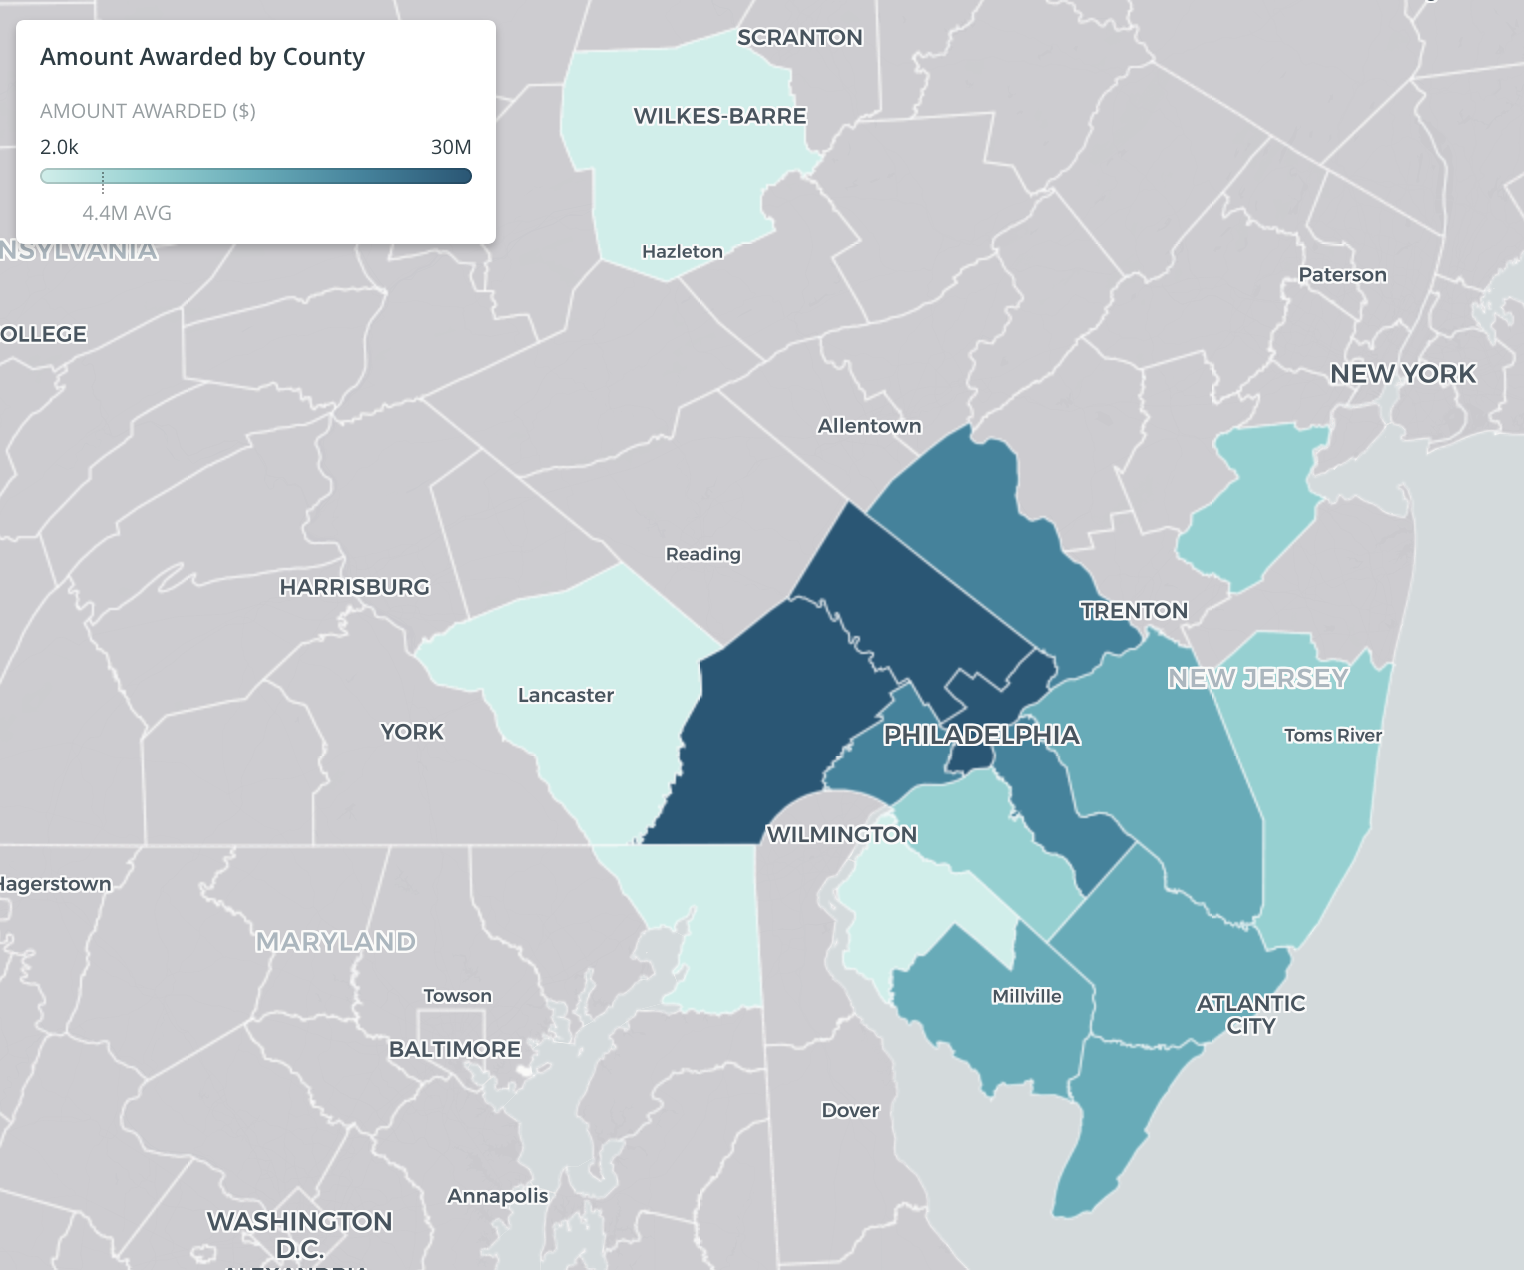
Grants awarded by county-level service area
For all 13 funds, we visualized grants awarded by the county-level service area. In addition to the 10-county area featured here, participating funds awarded grants in Luzerne and Lancaster counties in Pennsylvania, Cecil County in Maryland, and Gloucester, Middlesex, Ocean, and Salem counties in New Jersey.
Grants awarded by Census-tract service area
7 funds provided grantee service area information, based on reported center point and service area radius. We also included service area data for the the PHL-COVID-19 Small Business Fund, using the business address as the service area center point. We then mapped those reported service areas by Census tract. We also zoom in on the Philadelphia county map so more detail is visible. Visit County Reports on the Grantmaking Maps tab to view more data and overlays, plus detailed maps for all 10 counties in the Southeastern Pennsylvania and Southern New Jersey Region.
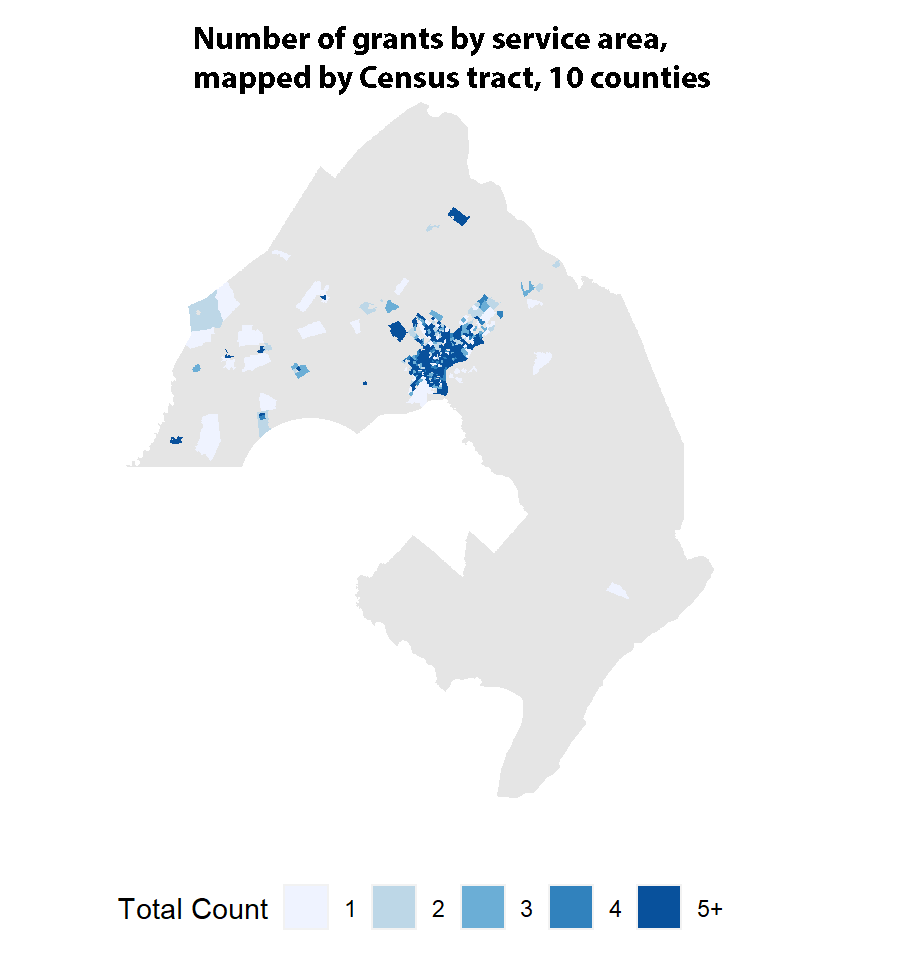
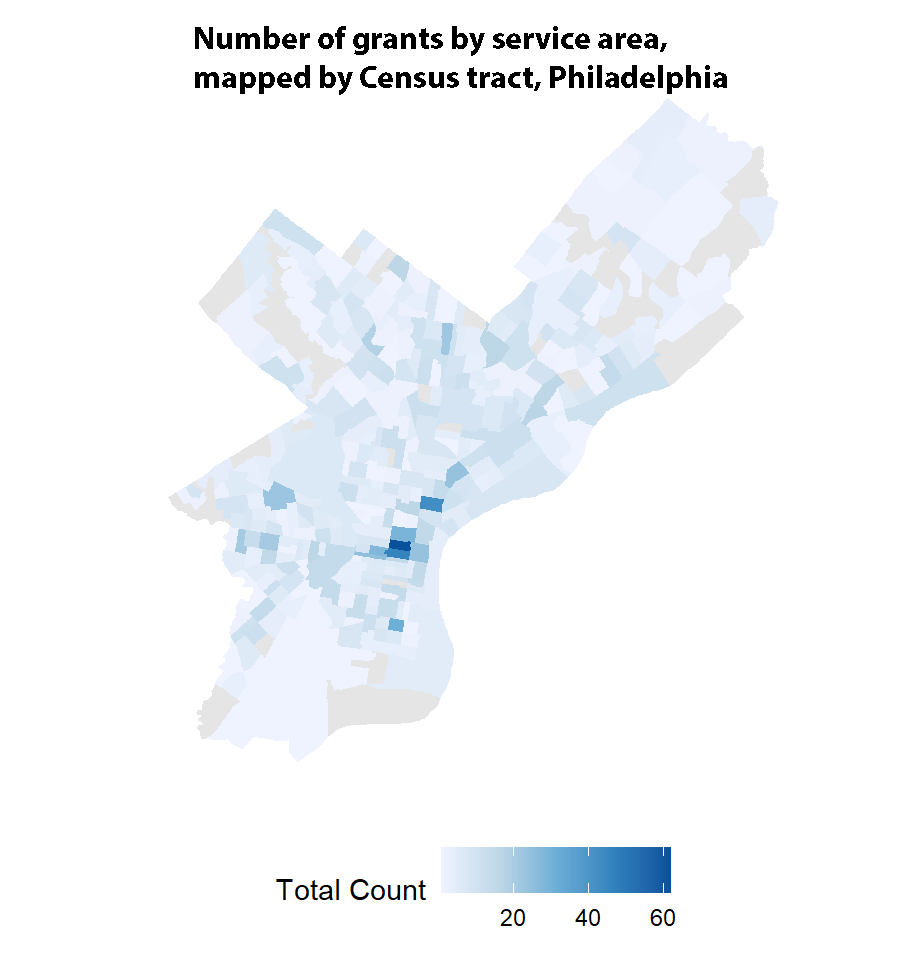
Note: Data includes grants made between March 18 and June 29, 2020.
Grants awarded by recipient address
Because only 7 funds provided grant awards by service area — i.e., the geographic area the grantee serves (vs. office address) for their grantees — we geocoded and mapped each organization using the organization’s address for all 13 funds. We also geocoded the address for individual grant recipients, when relevant. This does not necessarily reflect the grantee’s service area, but it gives a fuller picture of where grants were awarded.
Visit County Reports on the Grantmaking & Need Atlas (partner site) tab to view more data and overlays, plus detailed maps for all 10 counties in the Southeastern Pennsylvania and Southern New Jersey Region.
Note: Data includes grants made between March 18 and June 29, 2020.
How well were grants aligned with need?
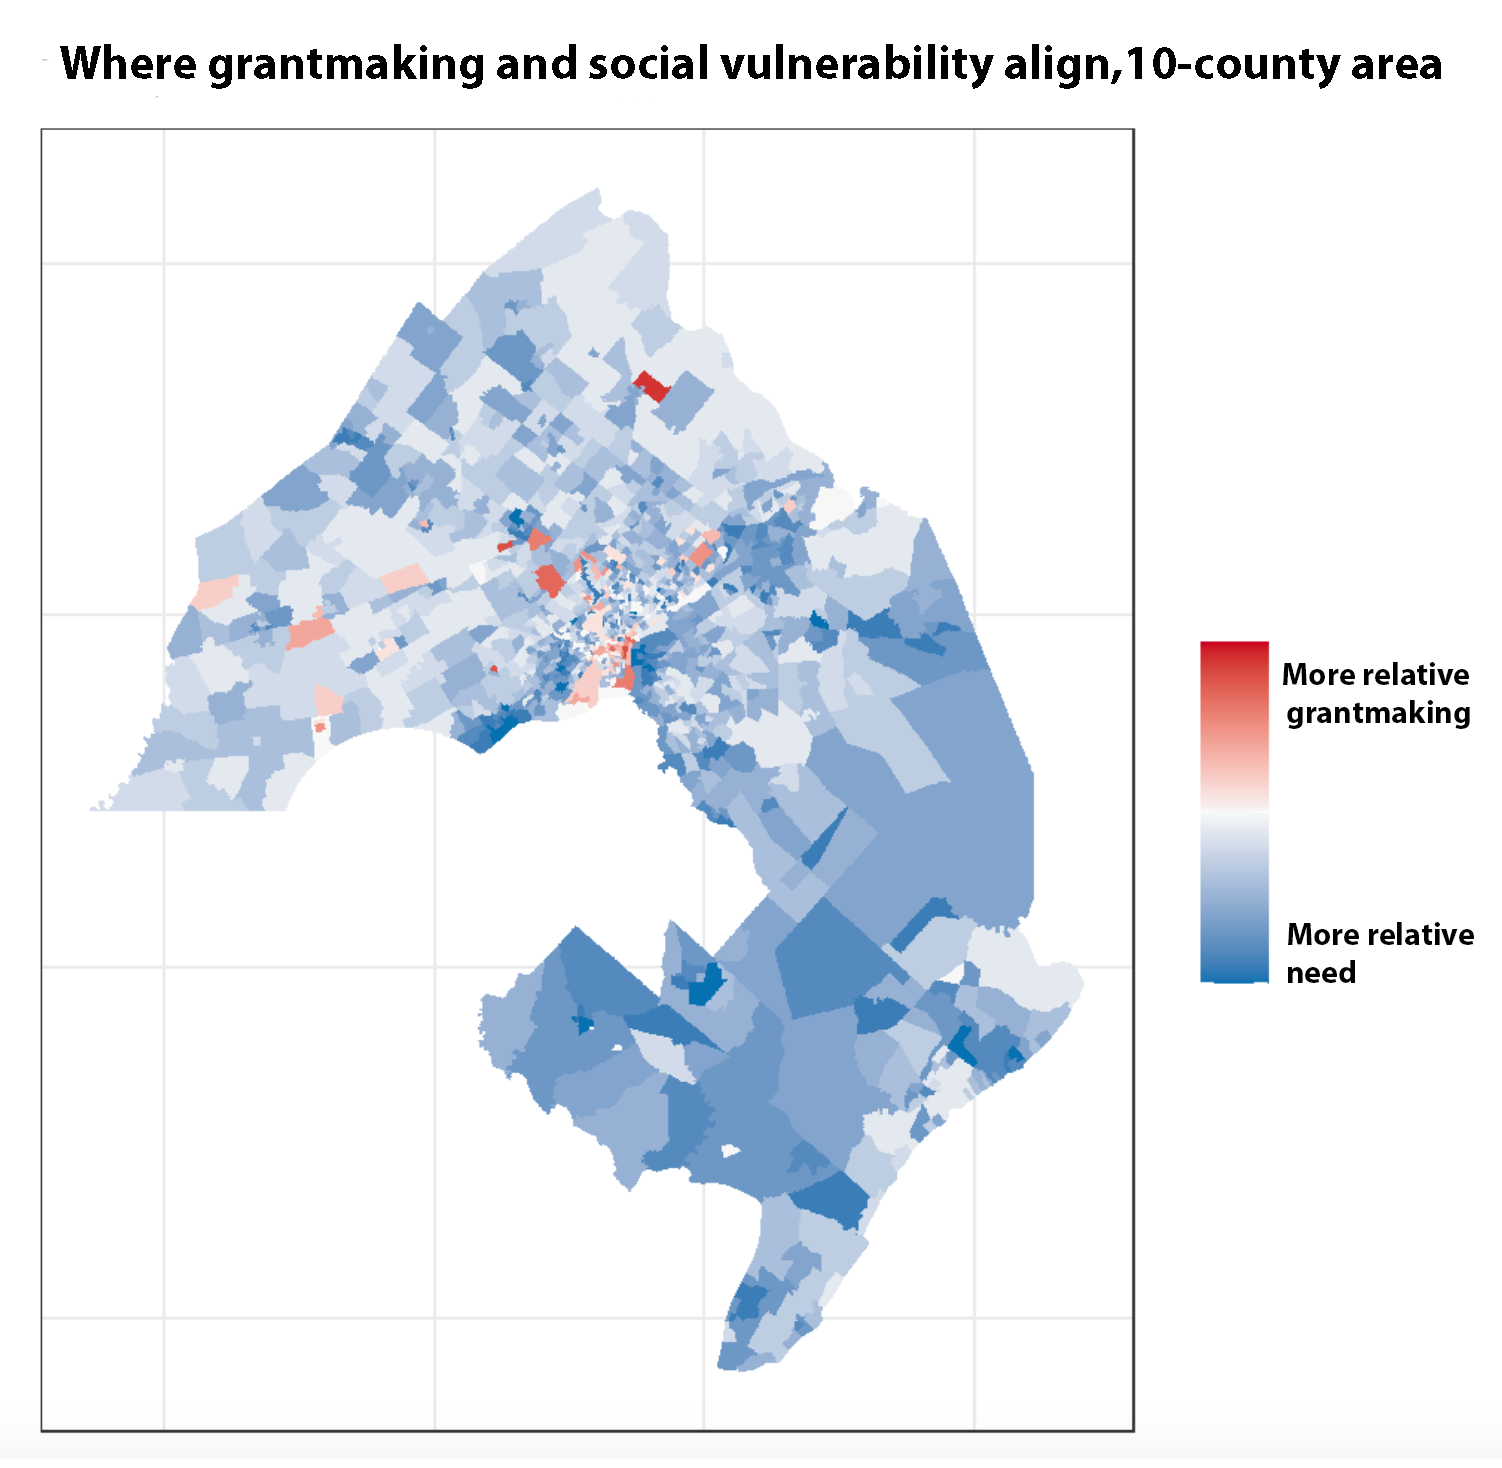
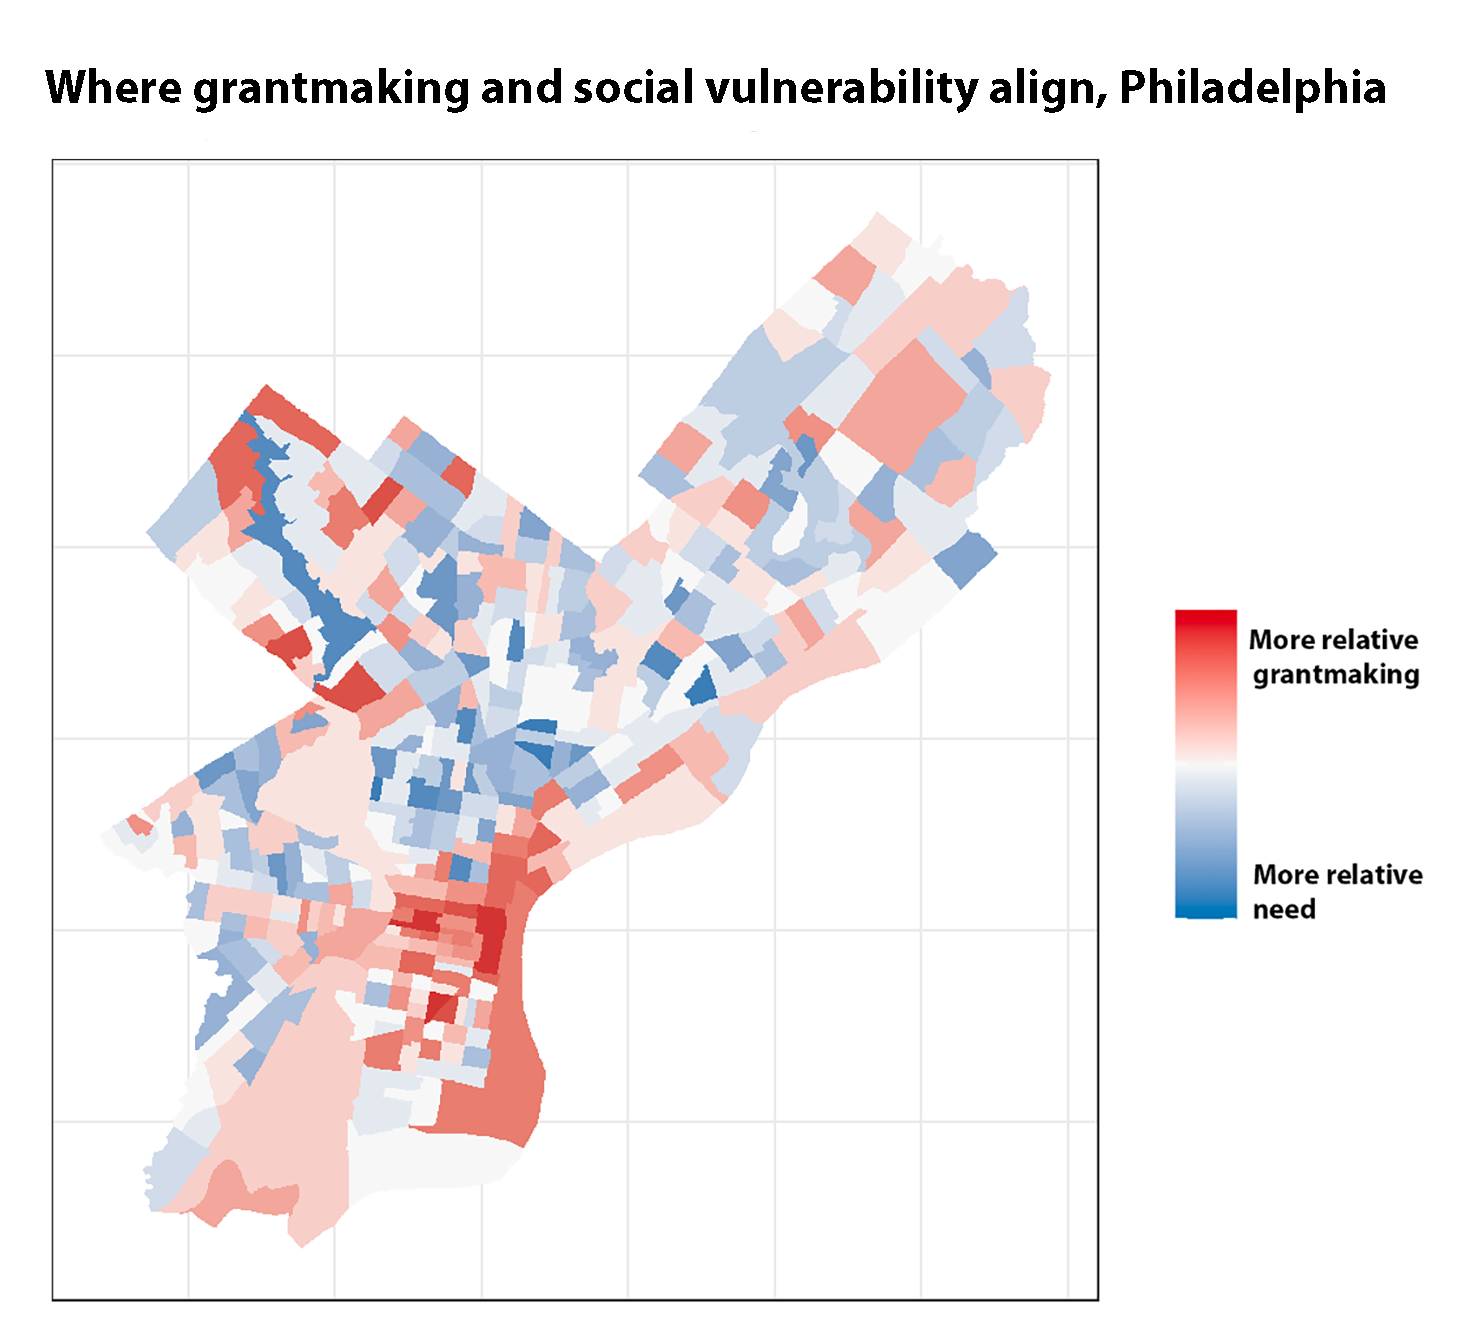
This map shows grant awards by service area — i.e., the geographic area the grantee serves (vs. office address) — overlaid with data from the Social Vulnerability index, a composite of need that includes 16 census variable measures of vulnerability, broadly grouped into socioeconomic, demographic, and housing/transportation categories. Darker shades of blue show Census tracts with more relative need compared to grant awards. They represent areas where future funding may be especially needed.
We also zoom in on the Philadelphia county map so more detail is visible. Visit County Reports on the Grantmaking & Need Atlas (partner site) view more data and overlays, plus detailed maps for all 10 counties in the Southeastern Pennsylvania and Southern New Jersey Region.
Quick Guides for:
This project includes an interactive, place-based planning tool hosted by partner Urban Spatial. Visit the Grantmaking & Need Atlas (partner site). The tool allows you to see the level of need (e.g., health, education, etc.) by county and census tract. It also allows you to map that need to grants awarded. The following quick guides list specific options for customizing the maps you see.
Special Populations
Children, youth, and families
If you fund services for children and youth, the following county-level maps on the Grantmaking & Need Atlas will be helpful:
4.6 Individuals aged under 18
4.7 Children under age 6
4.8 Access to childcare
6.2 Where do households with children receive food assistance?
The following Grant Award Analytics will also be helpful:
What needs did the money address?
Who were the people served?
Seniors
If you fund services for seniors, the following county-level maps on the Grantmaking & Need Atlas will be helpful:
3. Housing section
4.5 Individuals aged 65+
6. Food Insecurity section
7. Health section
The following Grant Award Analytics will also be helpful:
What needs did the money address?
Who were the people served?
Cause Areas
Arts & culture
If you fund arts and cultural organizations, the following county-level maps on the Grantmaking & Need Atlas will be helpful:
1.4 Where are individuals who are receiving grants located?
3. Employment
5.3 Where do workers live by sector (2018)?
The following Grant Award Analytics will also be helpful:
What needs did the money address?
Who were the people served?
Education
If you fund education, the following county-level maps on the Grantmaking & Need Atlas will be helpful:
4. Demographics section
4.6 Individuals aged under 18
4.7 Children under age 6
4.8 Access to childcare
5.1 Education attainment: High school degree and higher
6.2 Where do households with children receive food assistance?
The following Grant Award Analytics will also be helpful:
What needs did the money address?
Who were the people served?
Diversity and racial equity
If you are funding to increase racial equity, the following county-level maps on the Grantmaking & Need Atlas will be helpful:
2.1 Social vulnerability & grantmaking maps
2.3 Housing instability & grantmaking maps
4. Demographics section, including percentage of non-white households
The following Grant Award Analytics will also be helpful:
What needs did the money address?
Who were the people served?
Health
If you fund health, the following county-level maps on the Grantmaking & Need Atlas will be helpful:
3. Demographics
6. Food Insecurity
7. Health
The following Response Analytics will also be helpful:
What needs did the money address?
Who were the people served?
Economic Livelihoods
If you fund economic development and poverty reduction, the following county-level maps on the Grantmaking & Need Atlas will be helpful:
2.1 Social vulnerability & grantmaking maps
2.3 Housing instability & grantmaking maps
3. Housing section
4.2 Median Household Income
4.3 Poverty-rate across the region
5. Employment section
6. Food Insecurity section
The following Grant Award Analytics will also be helpful:
