Your past activity (inventory of time and money)
The inventory can take many forms, many of which do not require a considerable amount of time. For example, you can dedicate an hour, sit down with a pen and piece of paper, and make a list of the organizations you currently serve on the boards of and any nonprofits you have donated to while keeping in mind the questions above. If you decide you want to take the inventory one step further, data visualizations or ranked lists can be especially helpful because they can help you see patterns you might not have been aware of, especially the longer the time frame you consider.
For those of you seeking a more analytical approach to taking inventory, you may start by answering the following questions:
1. Which nonprofits have I supported in the past?
- How much money have I given? How has this changed over the years?
- How much time have I given? How has this changed over the years?
- What first prompted me to support these nonprofits?
2. Which cause areas (e.g., arts, education, environment, etc.) have I supported?
- How much money have I given? How has this changed over the years?
- How much time have I given? How has this changed over the years?
- What first prompted me to support these causes?
3. Which geographic areas (domestic and international) have I supported?
- How much money have I given? How has this changed over the years?
- How much time have I given? How has this changed over the years?
- What first prompted me to support these areas?
The answers to these questions will serve as your initial inventory. You may choose to depict this information visually, which we would highly recommend. Charts A and B below are examples based on Joe Smith’s family inventory analysis. Visualizing this information will help you see the largest ‘chunks’ of your giving as well as the fits and starts of your giving in these areas over time.
You may use your inventory to answer a second set of questions, the answers to which may help you clarify the good you wish to accomplish in the world. These questions include:
- Is there anything surprising?
- Is this what I want my future giving to look like?
- Is the thing that first prompted me to support these areas still important and relevant to me, to the broader community?
- Do I want to continue supporting these same areas with my time and/or money in the future?
- Is the relative share of time and money that I’ve spent in the past the same as what I want in the future?
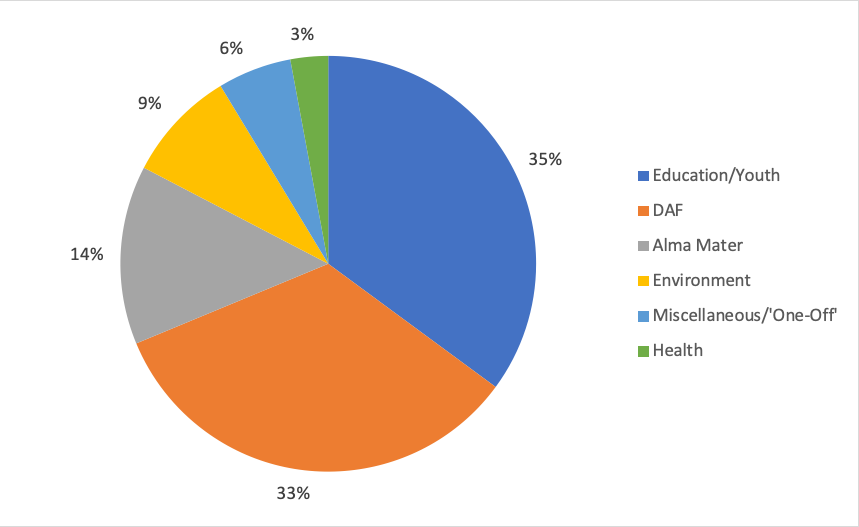
Chart A: Where I gave my money in the past 10 years
As you can see, Joe Smith’s family gave the most to Education/Youth programs over the 10-year timespan of this analysis. They were surprised to note that giving to their DAF was the second largest allocation and accounted for about a third of their total giving, which is also the case for many other donors. This is part of why there have been policy debates on the wisdom of having DAFs as a giving vehicle. For a donor asking themselves “how do I achieve the good I want to achieve,” recognizing resources available in a DAF is a great opportunity to reallocate.
Once you have seen this, especially pertaining to the DAF allocation, it can become apparent that you have greater resources available to you that are not yet working to achieve the good you want to accomplish in the world. This could be a good time to consider whether or not you would like to reallocate these resources to other areas you cared about in the past or it could be an opportunity to try something new.

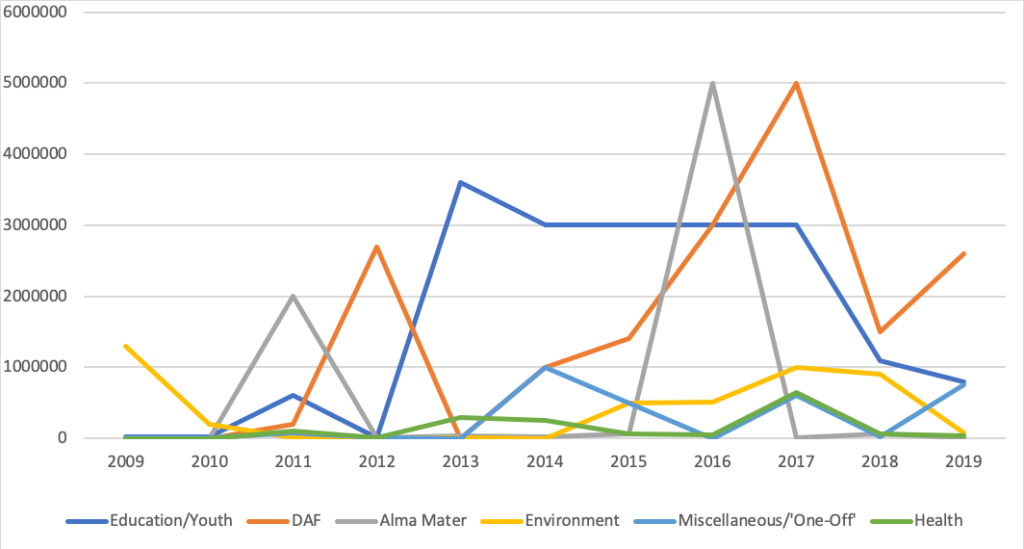
Chart B: How I gave my money to each of these cause areas over the past 10 years
While this chart may seem very busy, it’s a great indicator of the fits and starts of giving to particular areas. You may start out strong funding a program, but through your learning, you may identify a different opportunity in a different area that achieves greater results so you pivot funding. These fluctuations may also occur in tandem with the financial market. When your endowment increases or decreases, your annual giving amount will also increase or decrease, especially if you have a foundation, like Joe’s family, and need to meet the five percent requirement.

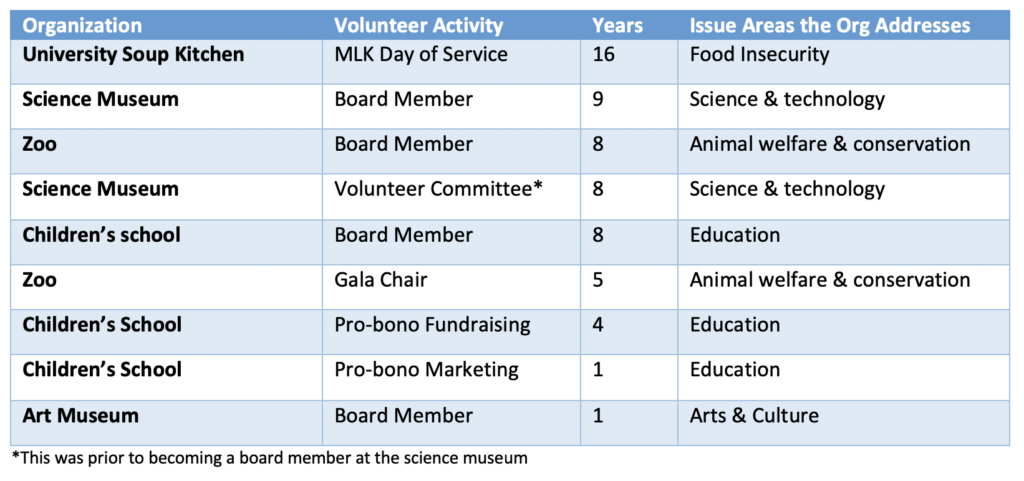
Table A: Where I Volunteered
This table is an example of Jane Doe’s volunteer inventory. Because Jane does not have a foundation or DAF, she chooses to do most of her financial giving with gifts of self, as well. This is depicted by her volunteer activities and time spent. We also know that donors tend to give more to the nonprofits they volunteer with because they feel a closer alignment to the mission and better understand the day-to-day operations.

